Data Analysis and Display Case Study
A Misinformed Approach to Data Analysis and Interpretation Carries a High Cost
The capacity for organizational improvement is interdependent with the capability to extract information from data and to convey that information to others in a way that helps to motivate change. Too often, management looks at absolute numbers or proportions without taking advantage of tools that help to assess for meaningful differences.
For example, this institution, looking to control costs, was concerned with physicians keeping patients in the hospital unnecessarily. Using Case Management data they identified the physicians who had the most avoidable days. Using a standard Pareto analysis, they found that 3 physicians were responsible for 37% of all avoidable days. 20 physicians account for 71% of all avoidable days
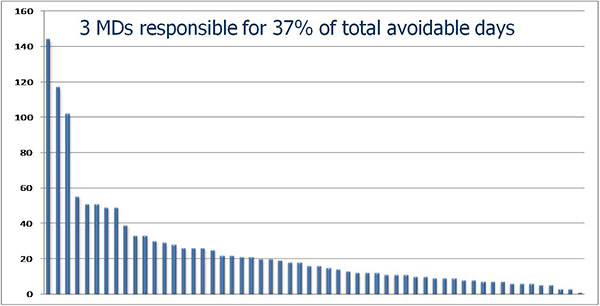
It would be all too easy (and wrong) to target the top 3, or even the top 20, for corrective action. This would be the classic QA fallacy. Further study shows that avoidable days are proportionate to total certified patient days. A deeper look at the proportions of avoidable days using an Analysis of Means approach (see below) shows that the majority of physicians are not practicing in a manner that is statistically different from the group mean, but clearly reveals the small number of high outliers. The top 3 are not among these.
More importantly, this approach identifies those physicians whose methods should be studied more closely to bring to light how they are achieving best practice results in this domain. There are 5 physicians whose rate of avoidable days is about half that of the group. They are identified as the 5 points below the lower red line. In the Analysis of Means graph, which looks quite similar to a Shewart control chart, the red lines designate the control limits. In this analysis, the control limits were set at 3 standard deviations. The likelihood of any point being above the upper limit or below the lower limit due to chance alone is only 1%. Thus, any outlier is most likely operating in a system that differs signficantly from the group average.
Given the more sophisticated understanding of the data, the old QA strategy would be focus on the outliers through coaching or other forms of influence. This exercise is still relatively futile. Even if these eight come to perform at the group average, only about 100 days would be saved (about 7% of total avoidable days). On the other hand, if the 5 best performers care for mainstream patients and conditions, there may be an opportunity to dramatically shift the curve of performance by 50% for the entire group by generalizing their methods. In other words, the QI approach has much greater potential than the QA-style "name and blame" alternative.
While it is optimal to use severity-adjusted data (e.g., APR-DRG), most organizations do not have this resource. In any event, severity-adjustment does not control for all sources of variation relevant to quality improvement work. The approach demonstrated here still provides valid information that can guide the leaders to take the next steps in tackling this issue from a quality improvement framework. One of those steps should include a check of avoidable day performance in relation to available quality of care measures. The other is to look for the commonalities within the group of high outliers and within the group of best performers. Management needs to understand how their respective "systems" vary from the group norm. While it is possible these differences may be explained by patient characterisitcs such as age, disease, disease severity, or treatment modality, it is more likely that they originate in the care processes and decision rules which these physicians employ.
Links
Services
- The Peer Review Enhancement ProgramSM
- Site Visit: A Jump-Start for Improvement
- DataDriverSM: The Power of Analysis
- From QA to QISM: Custom Solutions
- Client Testimonials
- Typical Client Results
Whitepapers